Data Analysis Demo
Document-wide toggle in action
This demo shows toggle enabled for every cell. Readers can hide outputs as they work through the analysis, revealing results only when ready.
The floating button in the corner toggles everything at once.
Configuration
extensions:
  toggle:
    output-toggle: true
    global-toggle: true
Loading the Data
We’ll analyze the mtcars dataset: 32 cars from 1974 Motor Trend magazine.
data(mtcars)
cat("Dataset dimensions:", nrow(mtcars), "rows,", ncol(mtcars), "columns\n")
Dataset dimensions: 32 rows, 11 columnshead(mtcars, 5) mpg cyl disp hp drat wt qsec vs am gear carb
Mazda RX4 21.0 6 160 110 3.90 2.620 16.46 0 1 4 4
Mazda RX4 Wag 21.0 6 160 110 3.90 2.875 17.02 0 1 4 4
Datsun 710 22.8 4 108 93 3.85 2.320 18.61 1 1 4 1
Hornet 4 Drive 21.4 6 258 110 3.08 3.215 19.44 1 0 3 1
Hornet Sportabout 18.7 8 360 175 3.15 3.440 17.02 0 0 3 2Exploratory Analysis
Fuel Efficiency
Miles per gallon ranges from gas-guzzlers to relatively efficient:
summary(mtcars$mpg) Min. 1st Qu. Median Mean 3rd Qu. Max.
10.40 15.43 19.20 20.09 22.80 33.90 hist(mtcars$mpg,
main = "Distribution of MPG",
xlab = "Miles per Gallon",
col = "steelblue",
border = "white")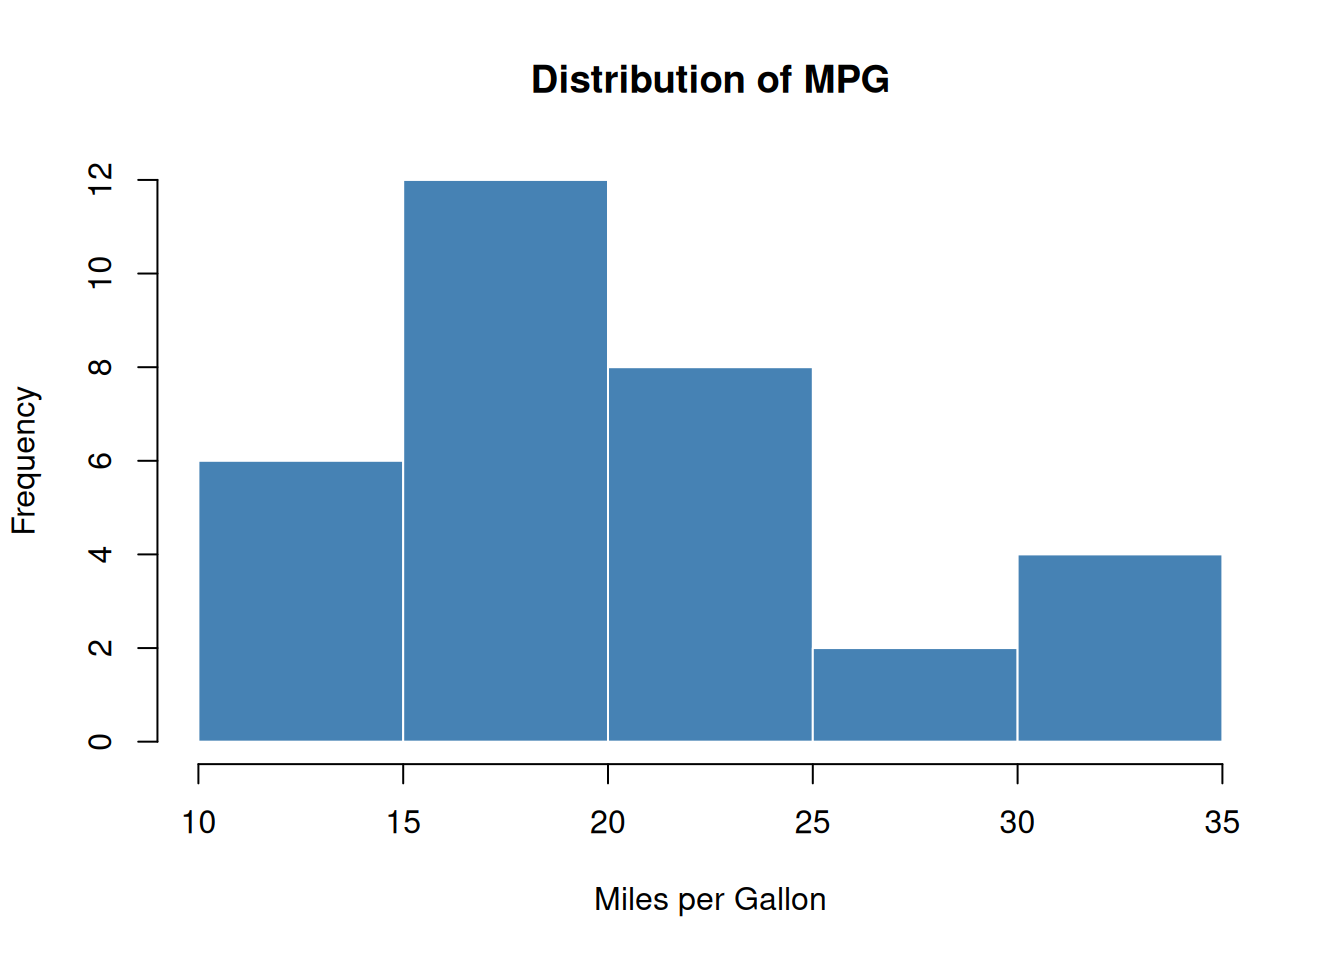
Engine Size
Most cars have either 4, 6, or 8 cylinders:
table(mtcars$cyl)
 4  6  8
11 7 14 barplot(table(mtcars$cyl),
main = "Cars by Cylinder Count",
xlab = "Cylinders",
ylab = "Count",
col = c("#4e79a7", "#f28e2b", "#e15759"))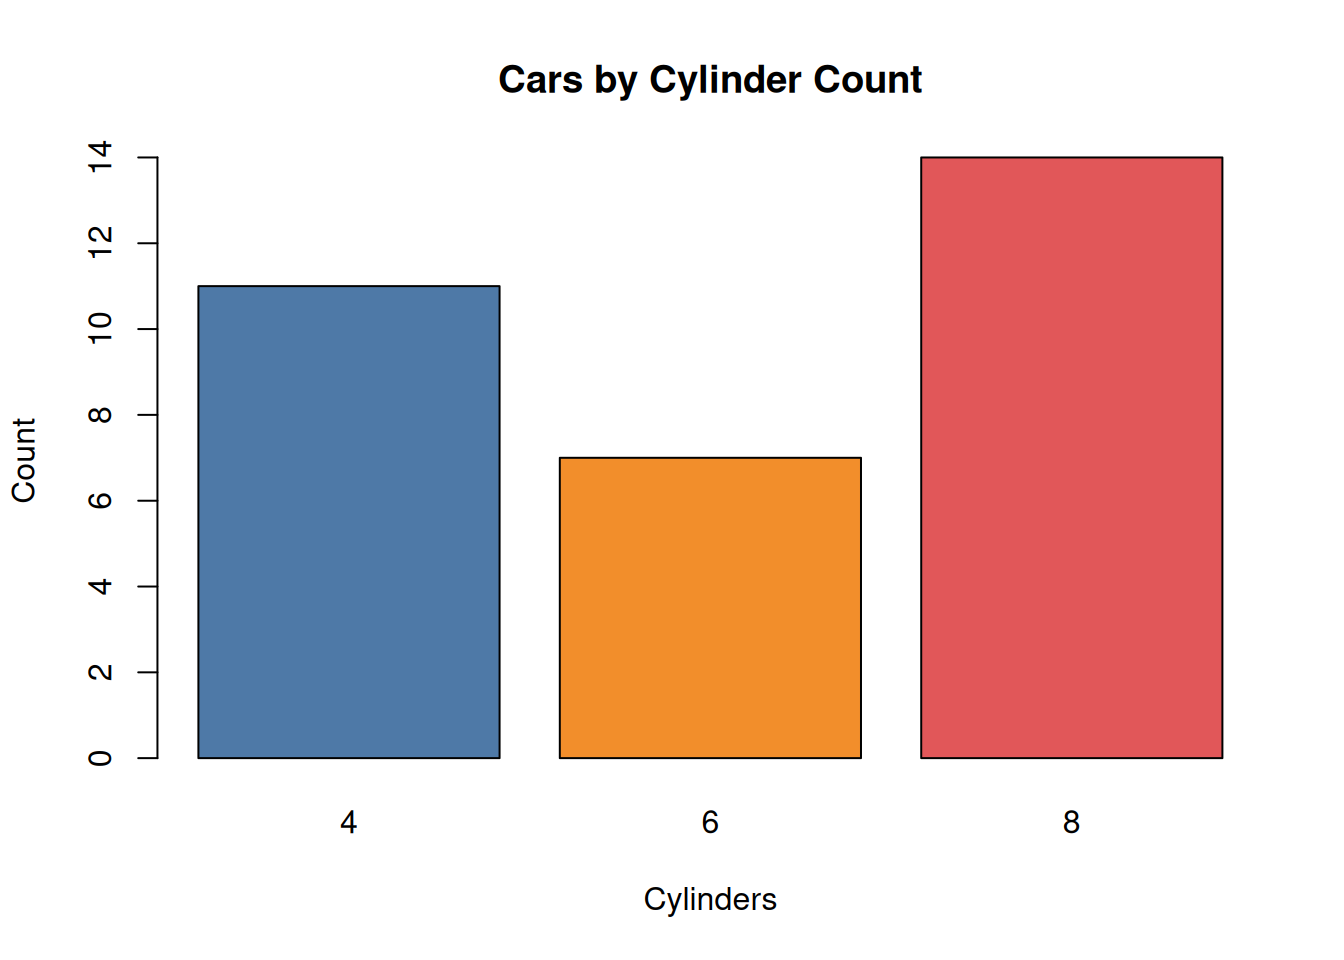
Relationships
MPG vs Weight
Heavier cars use more fuel:
cor(mtcars$mpg, mtcars$wt)[1] -0.8676594plot(mtcars$wt, mtcars$mpg,
main = "Weight vs MPG",
xlab = "Weight (1000 lbs)",
ylab = "Miles per Gallon",
pch = 19,
col = "steelblue")
abline(lm(mpg ~ wt, data = mtcars), col = "red", lwd = 2)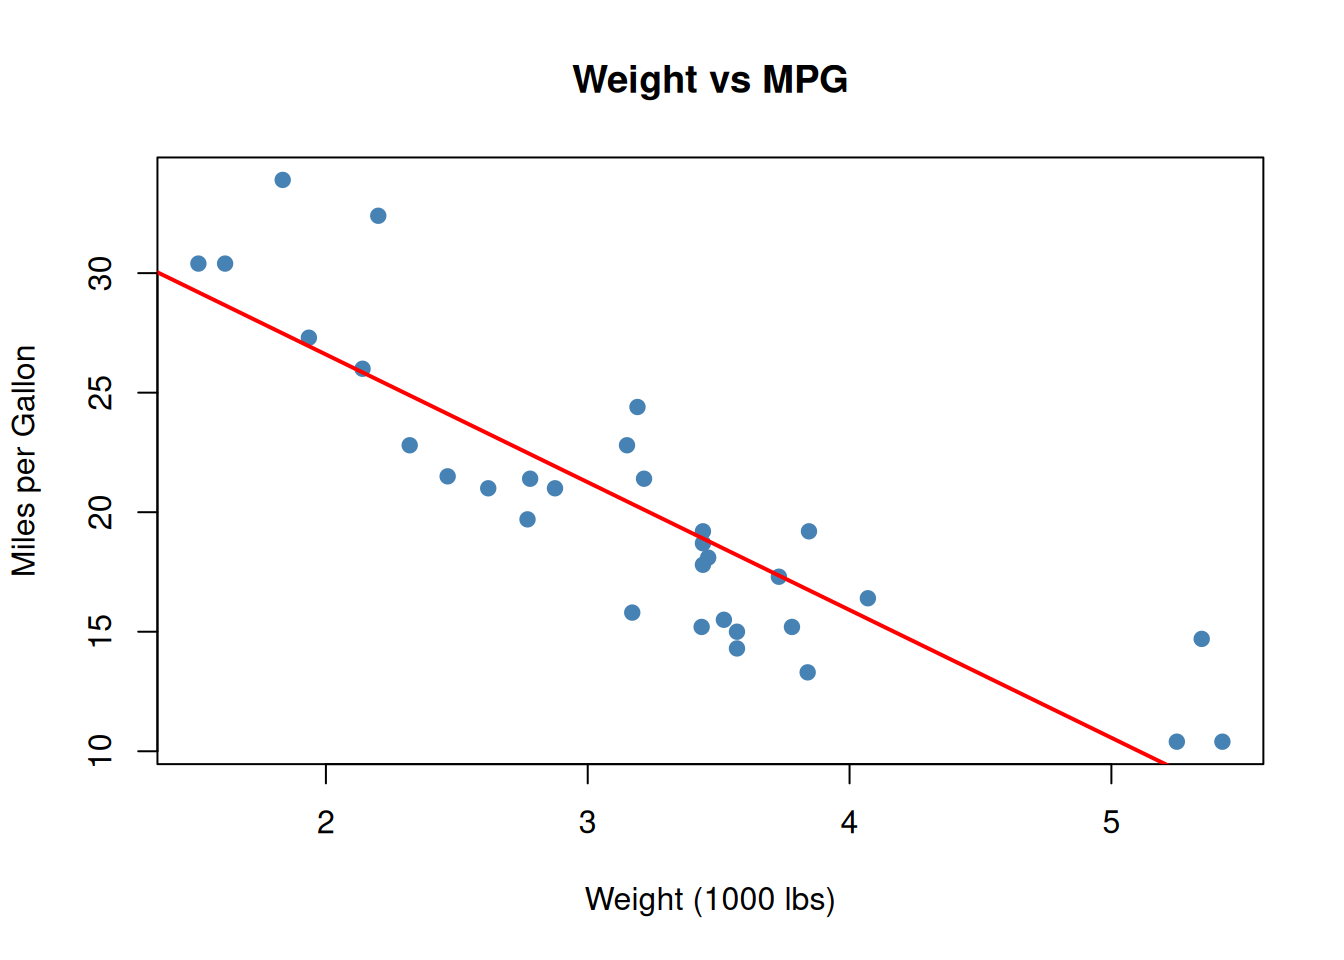
MPG by Transmission
Manual transmissions tend to be more efficient:
aggregate(mpg ~ am, data = mtcars, FUN = mean) am mpg
1 0 17.14737
2 1 24.39231boxplot(mpg ~ am, data = mtcars,
names = c("Automatic", "Manual"),
main = "MPG by Transmission Type",
ylab = "Miles per Gallon",
col = c("#f28e2b", "#4e79a7"))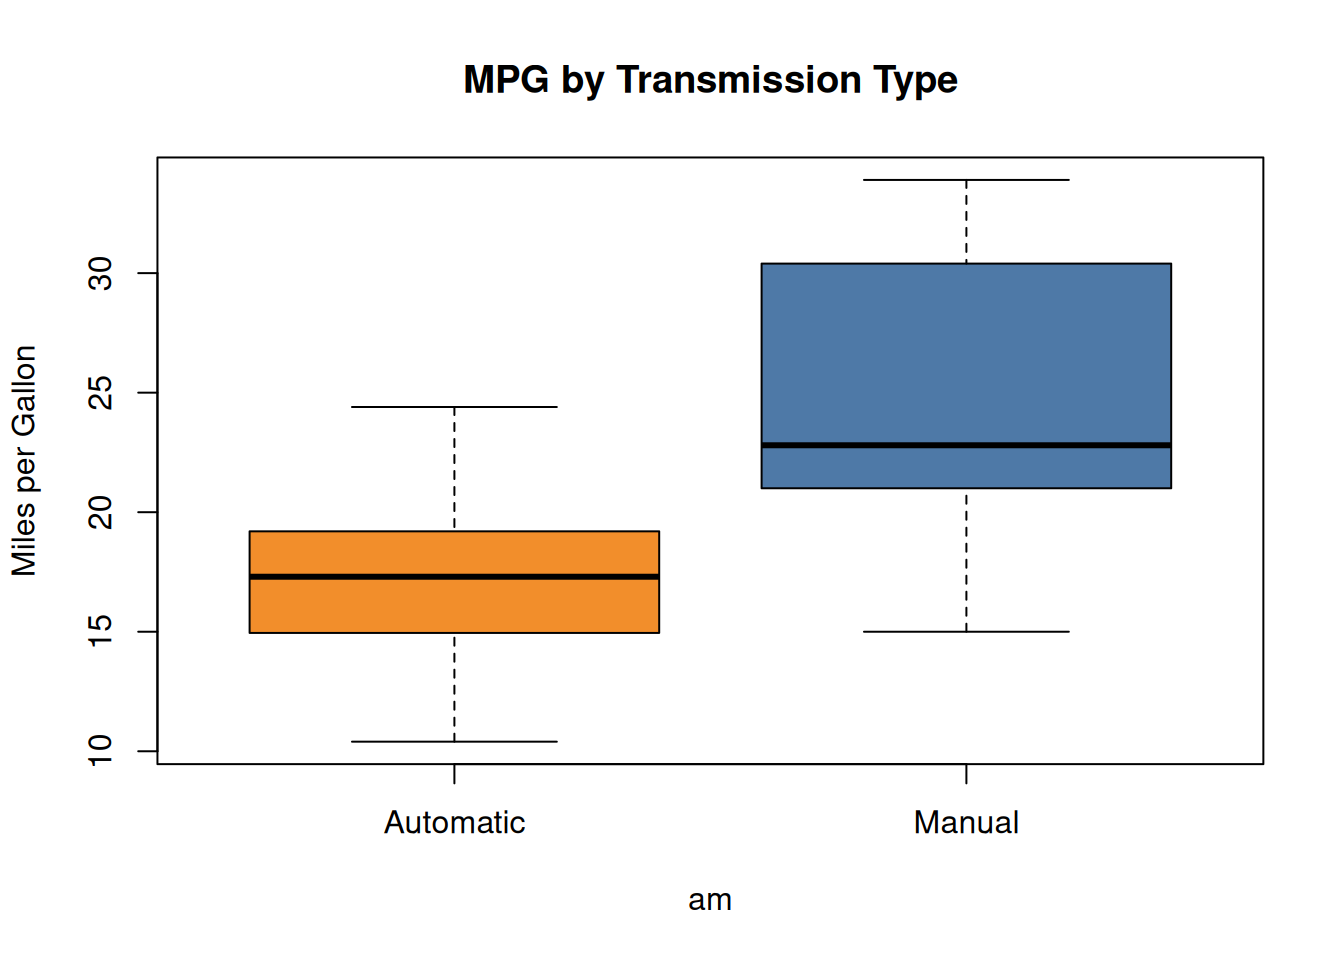
Summary
This demo showed toggle enabled document-wide with output-toggle: true. Every code cell got a toggle button, letting readers hide outputs as they work through the analysis.
The floating global button in the bottom-right corner toggles all outputs at once—useful for quickly clearing the page or revealing everything.