=== Customer Satisfaction Results ===Responses: 20Mean Score: 4.20 / 5.00Range: 3 - 5
Distribution: 3 stars: 3 (15%)
4 stars: 10 (50%)
5 stars: 7 (35%)For polished reports, you often want a clean narrative without inline code, while still providing comprehensive reproducibility materials. This example combines multiple options to create an executive-style document with a well-organized code appendix.
This report presents findings from our customer satisfaction survey. All statistical analyses are documented in the Reproducibility Materials appendix.
=== Customer Satisfaction Results ===Responses: 20Mean Score: 4.20 / 5.00Range: 3 - 5
Distribution: 3 stars: 3 (15%)
4 stars: 10 (50%)
5 stars: 7 (35%)=== Hypothesis Test ===H0: μ ≤ 3.0 (neutral or below)H1: μ > 3.0 (above neutral)Sample mean: 4.2 t-statistic: 7.712 p-value: 1.44e-07
Conclusion: Strong evidence that satisfaction exceeds neutral.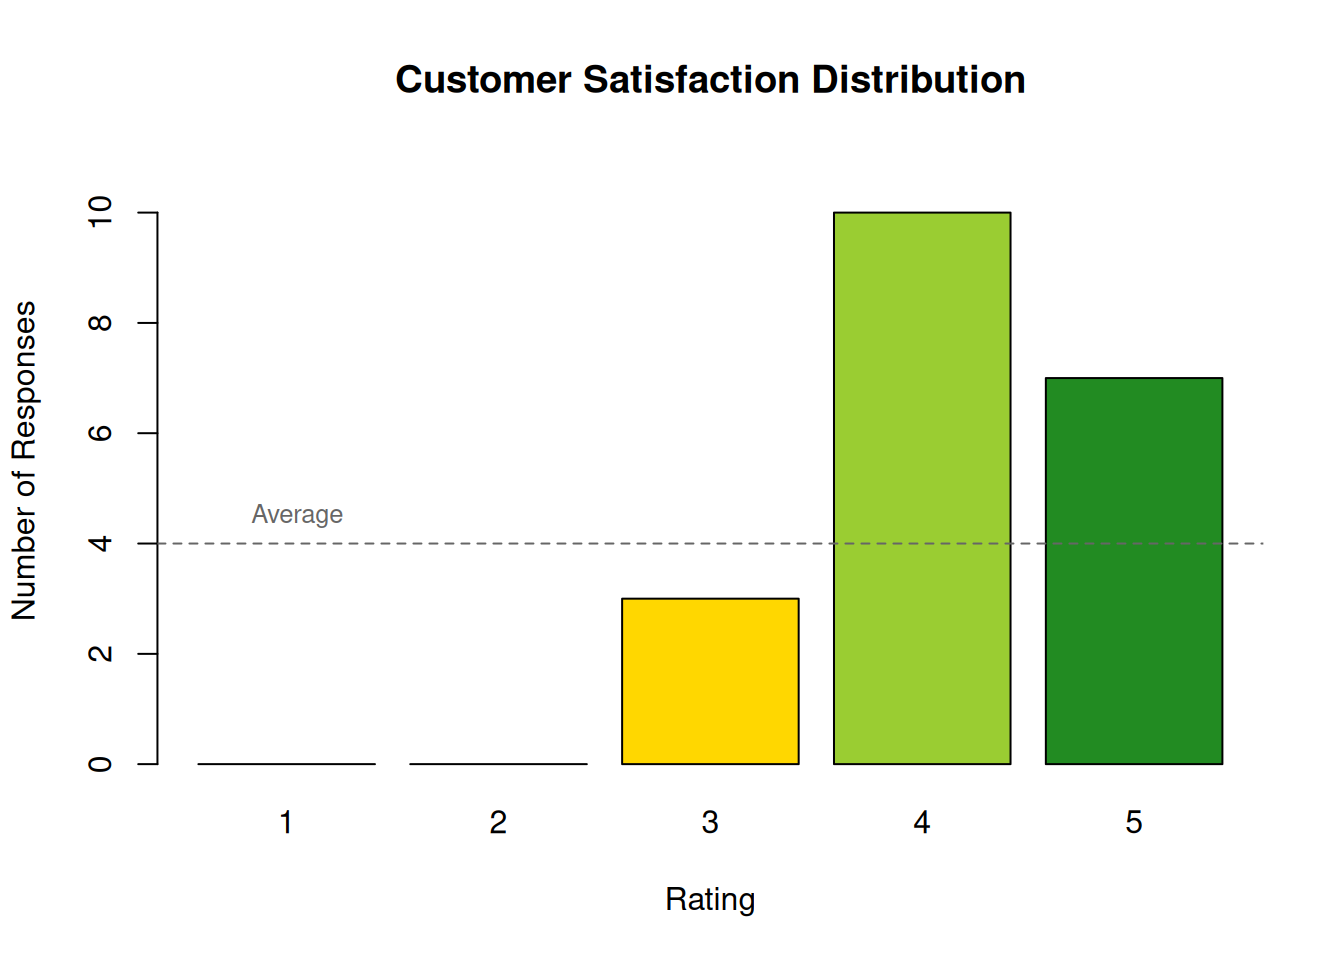
The survey results demonstrate strong customer satisfaction, with a mean rating significantly above neutral. The majority of respondents (85%) gave ratings of 4 or 5 stars.
Above, you see only the results—no code interrupts the narrative. The appendix titled “Reproducibility Materials” contains numbered, collapsible, language-grouped source code with filenames, providing a complete reference without cluttering the main report.
Code Block 1
File: analysis/summary_stats.py
# Survey response data (1-5 scale)
responses = [4, 5, 3, 4, 5, 4, 3, 5, 4, 4,
             5, 4, 4, 3, 5, 4, 5, 4, 4, 5]

n = len(responses)
mean_score = sum(responses) / n
min_score, max_score = min(responses), max(responses)

# Count by rating
from collections import Counter
distribution = Counter(responses)

print("=== Customer Satisfaction Results ===")
print(f"Responses: {n}")
print(f"Mean Score: {mean_score:.2f} / 5.00")
print(f"Range: {min_score} - {max_score}")
print("\nDistribution:")
for score in sorted(distribution.keys()):
    pct = distribution[score] / n * 100
print(f" {score} stars: {distribution[score]} ({pct:.0f}%)")Code Block 2
File: analysis/hypothesis_test.R
# Test if mean satisfaction exceeds neutral (3.0)
responses <- c(4, 5, 3, 4, 5, 4, 3, 5, 4, 4,
               5, 4, 4, 3, 5, 4, 5, 4, 4, 5)

result <- t.test(responses, mu = 3, alternative = "greater")

cat("=== Hypothesis Test ===\n")
cat("H0: μ ≤ 3.0 (neutral or below)\n")
cat("H1: μ > 3.0 (above neutral)\n\n")
cat("Sample mean:", round(mean(responses), 2), "\n")
cat("t-statistic:", round(result$statistic, 3), "\n")
cat("p-value:", format.pval(result$p.value, digits = 3), "\n")
cat("\nConclusion: Strong evidence that satisfaction exceeds neutral.\n")
Code Block 3
File: analysis/visualization.R
responses <- c(4, 5, 3, 4, 5, 4, 3, 5, 4, 4,
               5, 4, 4, 3, 5, 4, 5, 4, 4, 5)

# Create a bar chart of response distribution
counts <- table(factor(responses, levels = 1:5))
colors <- c("firebrick", "darkorange", "gold", "yellowgreen", "forestgreen")

barplot(counts,
        main = "Customer Satisfaction Distribution",
        xlab = "Rating",
        ylab = "Number of Responses",
        col = colors,
        ylim = c(0, max(counts) + 1))

abline(h = mean(counts), lty = 2, col = "gray40")
text(0.5, mean(counts) + 0.5, "Average", adj = 0, cex = 0.8, col = "gray40")Code Block 4
extensions:
  regurgitate:
    group-by-language: true       # Group by language
    show-code-inline: false       # Hide code in body
    show-output-results: false    # Code-only appendix
    appendix-title: "Reproducibility Materials"
    appendix-level: 2             # Subsection level
    number-blocks: true           # Number each block
    collapsible: true             # Expandable sections
    show-filename: true           # Show file sources